Ferranti Effect vs. Corona Effect vs. Reactive Power Effects


Ferranti Effect vs. Corona Effect vs. Reactive Power Effects

A complete technical comparison for long AC transmission lines

This is a new, standalone authority article, explaining how these three major AC phenomena differ, how they interact, and how engineers analyze them. Highly optimized for search engines and excellent as an anchor post.

If you want Blogger-ready HTML, just tell me after.


1. Introduction

Long AC transmission lines exhibit several electrical phenomena that affect voltage, power flow, stability, and insulation requirements. Three of the most important are:

  • Ferranti Effect — voltage rises at the receiving end

  • Corona Effect — ionization of air around conductors

  • Reactive Power Effects — charging currents, VAR flow, power factor challenges

These phenomena are often confused, but they arise from different mechanisms, have different impacts, and require different mitigation strategies.

This article gives a deep technical comparison.
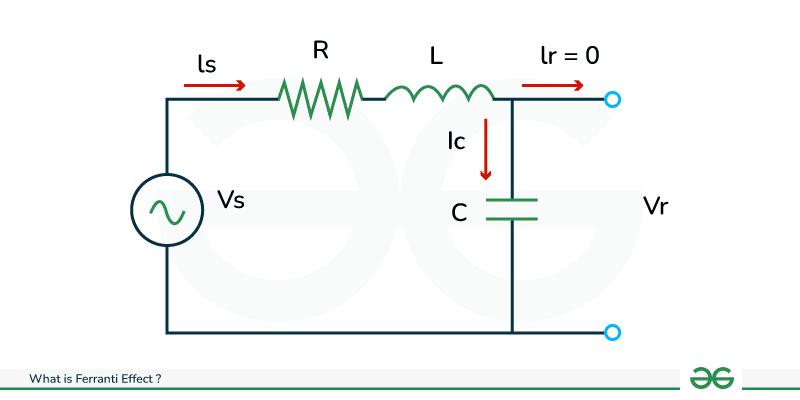

2. Ferranti Effect

Voltage rise due to distributed capacitance

The Ferranti Effect occurs on long, lightly loaded AC transmission lines, causing the receiving-end voltage to exceed the sending-end voltage due to line capacitance and inductance interactions.

Root Mechanism

  • Line capacitance generates leading reactive power

  • This current leads voltage by 90°

  • Line inductance causes additional voltage rise

  • The rise compounds along the line (distributed effect)

VR=VScosh(γl)V_R = V_S \cosh(\gamma l)

Where γ=LC\gamma = \sqrt{LC}.

When It Occurs

  • Line length > 200–250 km (AC)

  • Voltage level ≥ 220 kV

  • Light or zero load

Key Symptoms

  • Overvoltage at receiving end

  • VAR generation from line

  • Stress on insulators, arresters, transformers

Mitigation

  • Shunt reactors

  • Series compensation

  • Controlled switching

  • FACTS devices (STATCOM/SVC)


3. Corona Effect

Ionization of air surrounding conductors under high electric stress

The Corona Effect is a localized surface phenomenon where air molecules near the conductor are ionized, causing:

  • power loss

  • audible noise

  • radio interference

  • UV light and ozone generation

Root Mechanism

Occurs when the electric field gradient exceeds the critical disruptive voltage:

Ec=δg0m0E_c = \delta \, g_0 \, m_0

Where:

  • δ\delta = air density factor

  • g0g_0 = 30 kV/cm (breakdown electric field)

  • m0m_0 = surface irregularity factor

Key Symptoms

  • Purple glow around conductors

  • Audible humming

  • Radio interference (RIV)

  • Power loss due to ionization

Conditions That Increase Corona

  • High voltage

  • Bad weather (rain, fog, humidity)

  • Rough or dirty conductors

  • Small-diameter conductors

Mitigation

  • Bundled conductors (increase effective diameter)

  • Smooth, polished, or coated conductors

  • Corona rings at line terminations

  • Maintaining proper conductor spacing


4. Reactive Power Effects

Behavior of inductive and capacitive VARs in long AC systems

Reactive power affects voltage control, stability, and line loading.

Root Mechanism

In AC systems:

  • Inductive components absorb VARs

  • Capacitive components generate VARs

Transmission lines generate capacitive VARs due to distributed capacitance:

Ic=ωCVI_c = \omega C V

Transformers and motors absorb inductive VARs.

Key Symptoms

  • Voltage instability (over/under-voltage)

  • Increased current flow

  • Reduced real power transfer capability

  • Oscillation risk

Causes in Transmission Lines

  • Light loading → capacitive VAR dominance

  • Heavy loading → inductive VAR dominance

  • Long 400–765 kV lines → high charging currents

Mitigation

  • SVC, STATCOM

  • Shunt reactors / capacitors

  • Series compensation

  • On-load tap-changing transformers (OLTC)

The Ferranti Effect: A Complete Technical Guide

The Ferranti Effect: A Complete Technical Guide

Why sending-end voltage becomes higher than receiving-end voltage on long, lightly loaded AC transmission lines


🔍 1. What Is the Ferranti Effect?

The Ferranti Effect is a phenomenon where the receiving-end voltage of a long AC transmission line becomes higher than the sending-end voltage, even though no mechanical tap-up or control action is applied.

This effect occurs when:

  • The line is long (typically > 200 km for EHV AC)

  • The line is lightly loaded or open-circuited

  • The system voltage is high (≥ 220 kV)

In short:

👉 Light load + long AC line = voltage rise at the receiving end

Because the line’s distributed capacitance draws a leading charging current, causing voltage amplification toward the receiving end.


⚙️ 2. Why the Ferranti Effect Happens

Long AC lines behave like distributed RLC circuits.
When there is little or no load:

1️⃣ The line capacitance draws a leading charging current

Transmission lines have inherent capacitive effects:

  • Conductor-to-earth capacitance

  • Conductor-to-conductor mutual capacitance

This causes charging current:

Ic=ωCVI_c = \omega C V

This charging current leads the voltage by 90°.

2️⃣ Line inductance creates reactive voltage drop

The line inductance (L) creates voltage rise when the current is leading:

VL=IcXLV_L = I_c X_L

Thus:

  • Capacitive reactive power is generated along the length

  • Inductive voltage rise adds to the magnitude

  • Voltage at the receiving end increases

3️⃣ Distributed parameters amplify the effect

In long lines, the effect compounds along each small segment.


📏 3. Mathematical Explanation

For a lossless line:

VR=VScosh(γl)ISZcsinh(γl)V_R = V_S \cosh(\gamma l) - I_S Z_c \sinh(\gamma l)

Under open-circuit condition:

IS=0I_S = 0

Thus:

VR=VScosh(γl)V_R = V_S \cosh(\gamma l)

Because:

cosh(γl)>1\cosh(\gamma l) > 1

➡️ Receiving-end voltage > Sending-end voltage

Where:

  • γ=LC\gamma = \sqrt{LC} = propagation constant

  • ll = line length

  • Zc=L/CZ_c = \sqrt{L/C} = surge impedance

The longer the line and the higher the voltage, the greater the voltage rise.


🧮 4. Numerical Example (Realistic EHV Case)

500 kV AC line, length = 300 km
Typical line parameters per phase:

  • Capacitance C=0.012μF/kmC = 0.012 \, \mu F/km

  • Inductive reactance XL=0.35Ω/kmX_L = 0.35\, \Omega/km

  • No load at receiving end

Step 1 — Compute charging current

Ic=ωCV=2π(60)(0.012e6)(500e3)=2.26A/kmI_c = \omega CV = 2\pi(60)(0.012e^{-6})(500e^3) = 2.26 \, A/km

Over 300 km:

Itotal=2.26×300=678AI_{total} = 2.26 \times 300 = 678 \, A

Step 2 — Voltage rise

Vrise=ItotalXL=678(0.35300)V_{rise} = I_{total} \cdot X_L = 678 \cdot (0.35 \cdot 300) =678105=71,190V= 678 \cdot 105 = 71,190 \, V

Step 3 — Receiving-end voltage

VR=500kV+71kV=571kVV_R = 500 kV + 71 kV = 571 kV

➡️ Voltage rises by ~14%
This is a very typical Ferranti effect magnitude for long, lightly loaded AC lines.


🚨 5. Why the Ferranti Effect Is Dangerous

⚠️ Overvoltage on equipment

Insulators, transformers, arresters, and breakers can exceed BIL.

⚠️ Resonance conditions

Line capacitance + system inductance → resonance risk.

⚠️ Reactive power imbalance

Uncontrolled reactive power generation leads to:

  • Voltage instability

  • Under/overvoltage trips

  • Oscillations

⚠️ Parallel line interaction

Loaded and unloaded lines create:

  • circulating reactive currents

  • voltage imbalance


🛠️ 6. How Utilities Mitigate the Ferranti Effect

✔ 1. Shunt Reactors

This is the most common solution.

Reactors are placed:

  • at line ends

  • at intermediate substations

  • on tertiary windings

They absorb excessive reactive power:

Qabsorbed=ωLI2Q_{absorbed} = \omega L I^2

✔ 2. Controlled Switching

Used on:

  • 400 kV

  • 500 kV

  • 765 kV lines

Ensures the line is energized at the exact voltage minimum.

✔ 3. FACTS Devices

  • STATCOM

  • SVC

  • TCSC

  • MSC/MRC

Provide dynamic voltage control.

✔ 4. Line Shutoff / Reconfiguration

At night, some utilities:

  • open long lines

  • re-route load

  • reduce no-load energization

✔ 5. Bundled Conductors

Larger diameters reduce reactance and modify capacitance.


🔬 7. Systems Where Ferranti Effect Is Most Severe

  • 500 kV, 735 kV, and 765 kV AC lines

  • Lines > 200 km

  • High-capacitance lines (closely spaced bundles)

  • Light-load conditions (nighttime, low demand)

  • Remote hydro → urban grid corridors

  • Offshore AC links (wind farms)

  • Mountain valley long-span lines

Top 5 Worst Transmission Line Disasters in History


Top 5 Worst Transmission Line Disasters in History

Causes, technical failures, cascading effects, and engineering lessons learned

This article focuses on the largest, most disruptive, and most studied failures involving overhead transmission lines—due to storms, ice, fire, earthquakes, design flaws, and systemic weaknesses.

If you want the Blogger-ready HTML, tell me after reading.


🌩️ TOP 5 WORST TRANSMISSION LINE DISASTERS IN HISTORY


⚠️ 1. North American Northeast Blackout – 2003 (USA & Canada)

Impact: 55 million people affected
Cause: Transmission line contact with trees + grid instability
Region: Ohio, Michigan, Ontario, New York
Duration: 2–4 days (some areas 1 week)
Outage Size: 61,800 MW lost

The 2003 blackout is the most studied transmission-related disaster in history.

Root Transmission-Line Failures

  • A 345 kV line sagged into overgrown trees due to inadequate vegetation management.

  • Three more lines tripped sequentially under overload.

  • Operators were unaware because the alarm server at FirstEnergy failed silently.

Technical Failure Chain

  1. Excessive conductor temperature → sag → vegetation contact

  2. Protection relays tripped the lines

  3. Power rerouted → overload on adjacent lines

  4. Voltage collapse across the Great Lakes region

  5. Cascading outages across 8 U.S. states + Ontario

Key Engineering Lessons

  • Vegetation management must be treated as a critical protection function.

  • SCADA alarms require redundancy.

  • High-voltage AC grid must use adaptive islanding to avoid cascade.

  • Dynamic line rating (DLR) can prevent overheating.


⚠️ 2. Québec Ice Storm Transmission Collapse – 1998 (Canada)

Impact: Entire Montréal region blacked out
Damage: 130+ transmission towers collapsed
Voltage Levels: 735 kV, 315 kV
Duration: Up to 3 weeks for some locations
Cause: Once-in-a-century super-icing storm

This was one of the worst physical failures of overhead lines ever recorded.

What Failed

  • Ice accretion exceeded 80–110 mm radial thickness.

  • Tower loads exceeded design by >250%.

  • Entire 735 kV lines collapsed like dominoes.

  • Multiple lines failed simultaneously → no redundancy.

Lessons Learned

  • Icing design standards changed globally after 1998.

  • Anti-icing conductor designs were adopted.

  • Bundled conductors are now designed for galloping under ice load.

  • Some utilities now use de-icing stations on 735 kV lines.


⚠️ 3. India Northern Grid Collapse – 2012 (World’s Largest Blackout)

Impact: 620 million people without power
Cause: Transmission overload + weak interregional ties
Region: North, East, Northeast India
Voltage Levels: 400 kV, 765 kV AC
Duration: 2 days

Trigger Event

  • Overdrawing by states overloaded key 400 kV corridors.

  • A 400 kV line tripped, pushing flow to parallel lines → overload → cascading failures.

  • Frequency fell to 47.6 Hz, causing collapse.

Physical Line Failures

  • Tower oscillations under heavy loading

  • Relay miscoordination

  • Series compensation instability

Lessons Learned

  • Strict load dispatch compliance

  • FACTS devices (STATCOMs, SVCs) for voltage stability

  • Underfrequency and undervoltage load-shedding automation


⚠️ 4. Chile 500 kV Earthquake Transmission Failure – 2010

Impact: 80% of Chile lost power
Cause: 8.8 magnitude earthquake + tower collapse
Transmission Level: 500 kV AC backbone
Region: Maule, Bio-Bío, Santiago

What Happened

  • Tower foundations failed due to soil liquefaction.

  • Several 500 kV towers collapsed.

  • Substations suffered mechanical damage.

  • Protective relays misinterpreted earthquake-related oscillations.

Engineering Failures

  • Older towers lacked seismic reinforcement.

  • Soil liquefaction was not reflected in vintage foundation designs.

  • Grid islanding was not fast enough.

Post-Event Engineering Innovations

  • Seismic-resistant tower bases

  • Deep micro-pile foundations

  • Earthquake-triggered controlled islanding systems


⚠️ 5. Brazil Rio Madeira 500 kV Corridor Collapse – 2014 (Windstorm + Design Flaw)

Impact: 250+ towers damaged
Cause: Extreme windstorm + structural weakness
Voltage: 500 kV AC
Region: Rondônia & Acre (Amazon)
Duration: Weeks to restore

Cause Breakdown

  • Amazon windstorm surpassed 150 km/h.

  • Towers failed due to:

    • weak bracing in older designs

    • insufficient wind load assumptions

    • poor soil anchoring in wetlands

Lessons Learned

  • Wind load maps in tropical storm zones must be updated.

  • Monsoon-grade anti-galloping spacers are required.

  • Modern tower designs use:

    • Corten weathering steel

    • wider crossarms

    • stronger X-bracing


⚠️ OTHER NOTABLE DISASTERS (brief)

🔹 Ukraine Power Grid Attacks (2015–2022)

  • Transmission towers destroyed by warfare

  • Required rapid emergency rebuild strategies

🔹 Texas Winter Storm (2021)

  • 345 kV grid derated due to icing + gas plant failures

  • Not as many towers collapsed, but systemwide collapse occurred

🔹 China Ice Storm (2008)

  • 1,500 towers damaged

  • Led to new anti-icing standards in China


⚙️ TOP ENGINEERING LESSONS ACROSS ALL DISASTERS

1. Vegetation Management = Protection Layer

  • Tree contact is the #1 cause of AC line faults worldwide.

  • Needs predictive thermal sag modeling.

2. Ice Loading Must Be Conservatively Designed

  • Ice storms cause more physical failures than hurricanes.

  • Anti-icing conductors and aerodynamic spacers essential.

3. Wide-Area Protection Systems Are Critical

Modern grids require:

  • synchrophasors (PMUs)

  • adaptive relays

  • traveling-wave fault locators

  • dynamic islanding

4. Redundancy Must Be Built into Transmission Corridors

Parallel lines reduce the risk of cascading outages.

5. Climate Models Must Be Updated

Old wind/ice maps are no longer valid due to:

  • climate change

  • new storm patterns

  • extreme weather intensification

Ferranti Effect vs. Corona Effect vs. Reactive Power Effects

  Ferranti Effect vs. Corona Effect vs. Reactive Power Effects A complete technical comparison for long AC transmission lines This is a n...

free counters