Top 5 Worst Transmission Line Disasters in History


Top 5 Worst Transmission Line Disasters in History

Causes, technical failures, cascading effects, and engineering lessons learned

This article focuses on the largest, most disruptive, and most studied failures involving overhead transmission lines—due to storms, ice, fire, earthquakes, design flaws, and systemic weaknesses.

If you want the Blogger-ready HTML, tell me after reading.


🌩️ TOP 5 WORST TRANSMISSION LINE DISASTERS IN HISTORY


⚠️ 1. North American Northeast Blackout – 2003 (USA & Canada)

Impact: 55 million people affected
Cause: Transmission line contact with trees + grid instability
Region: Ohio, Michigan, Ontario, New York
Duration: 2–4 days (some areas 1 week)
Outage Size: 61,800 MW lost

The 2003 blackout is the most studied transmission-related disaster in history.

Root Transmission-Line Failures

  • A 345 kV line sagged into overgrown trees due to inadequate vegetation management.

  • Three more lines tripped sequentially under overload.

  • Operators were unaware because the alarm server at FirstEnergy failed silently.

Technical Failure Chain

  1. Excessive conductor temperature → sag → vegetation contact

  2. Protection relays tripped the lines

  3. Power rerouted → overload on adjacent lines

  4. Voltage collapse across the Great Lakes region

  5. Cascading outages across 8 U.S. states + Ontario

Key Engineering Lessons

  • Vegetation management must be treated as a critical protection function.

  • SCADA alarms require redundancy.

  • High-voltage AC grid must use adaptive islanding to avoid cascade.

  • Dynamic line rating (DLR) can prevent overheating.


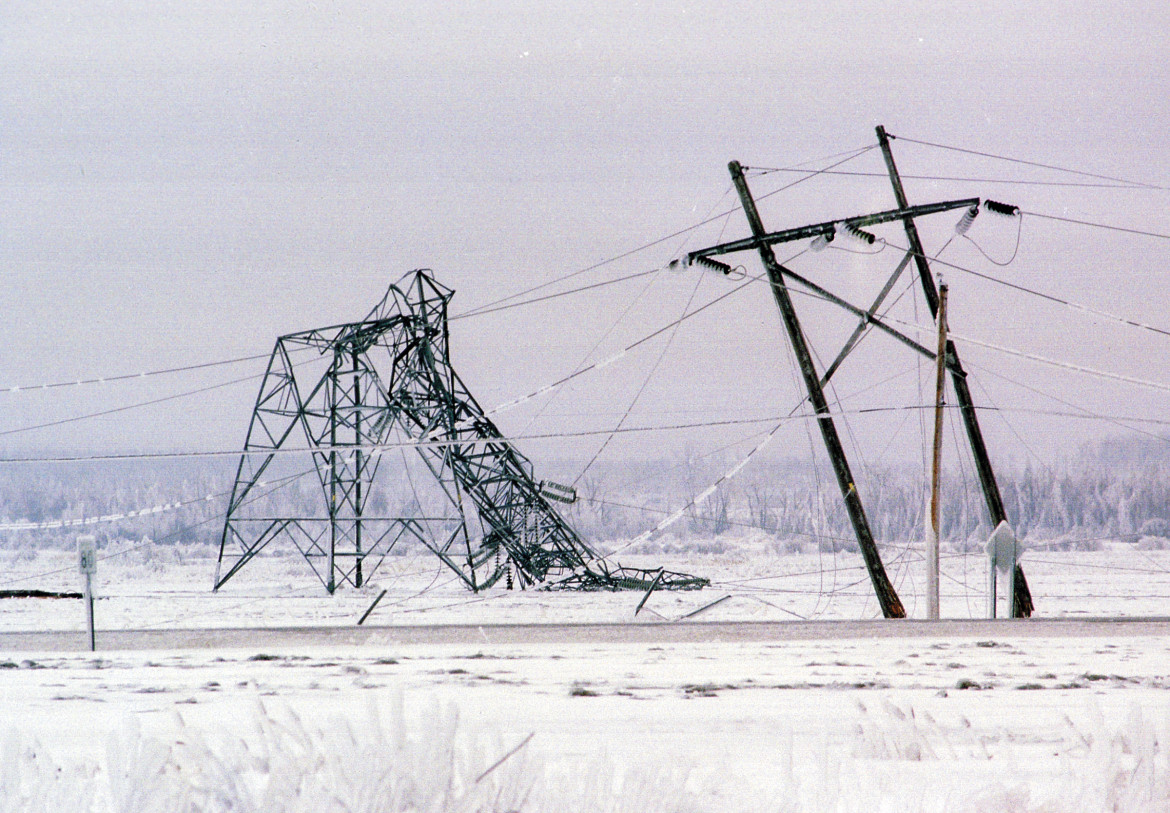
⚠️ 2. Québec Ice Storm Transmission Collapse – 1998 (Canada)

Impact: Entire Montréal region blacked out
Damage: 130+ transmission towers collapsed
Voltage Levels: 735 kV, 315 kV
Duration: Up to 3 weeks for some locations
Cause: Once-in-a-century super-icing storm

This was one of the worst physical failures of overhead lines ever recorded.

What Failed

  • Ice accretion exceeded 80–110 mm radial thickness.

  • Tower loads exceeded design by >250%.

  • Entire 735 kV lines collapsed like dominoes.

  • Multiple lines failed simultaneously → no redundancy.

Lessons Learned

  • Icing design standards changed globally after 1998.

  • Anti-icing conductor designs were adopted.

  • Bundled conductors are now designed for galloping under ice load.

  • Some utilities now use de-icing stations on 735 kV lines.


⚠️ 3. India Northern Grid Collapse – 2012 (World’s Largest Blackout)

Impact: 620 million people without power
Cause: Transmission overload + weak interregional ties
Region: North, East, Northeast India
Voltage Levels: 400 kV, 765 kV AC
Duration: 2 days

Trigger Event

  • Overdrawing by states overloaded key 400 kV corridors.

  • A 400 kV line tripped, pushing flow to parallel lines → overload → cascading failures.

  • Frequency fell to 47.6 Hz, causing collapse.

Physical Line Failures

  • Tower oscillations under heavy loading

  • Relay miscoordination

  • Series compensation instability

Lessons Learned

  • Strict load dispatch compliance

  • FACTS devices (STATCOMs, SVCs) for voltage stability

  • Underfrequency and undervoltage load-shedding automation


⚠️ 4. Chile 500 kV Earthquake Transmission Failure – 2010

Impact: 80% of Chile lost power
Cause: 8.8 magnitude earthquake + tower collapse
Transmission Level: 500 kV AC backbone
Region: Maule, Bio-Bío, Santiago

What Happened

  • Tower foundations failed due to soil liquefaction.

  • Several 500 kV towers collapsed.

  • Substations suffered mechanical damage.

  • Protective relays misinterpreted earthquake-related oscillations.

Engineering Failures

  • Older towers lacked seismic reinforcement.

  • Soil liquefaction was not reflected in vintage foundation designs.

  • Grid islanding was not fast enough.

Post-Event Engineering Innovations

  • Seismic-resistant tower bases

  • Deep micro-pile foundations

  • Earthquake-triggered controlled islanding systems


⚠️ 5. Brazil Rio Madeira 500 kV Corridor Collapse – 2014 (Windstorm + Design Flaw)

Impact: 250+ towers damaged
Cause: Extreme windstorm + structural weakness
Voltage: 500 kV AC
Region: Rondônia & Acre (Amazon)
Duration: Weeks to restore

Cause Breakdown

  • Amazon windstorm surpassed 150 km/h.

  • Towers failed due to:

    • weak bracing in older designs

    • insufficient wind load assumptions

    • poor soil anchoring in wetlands

Lessons Learned

  • Wind load maps in tropical storm zones must be updated.

  • Monsoon-grade anti-galloping spacers are required.

  • Modern tower designs use:

    • Corten weathering steel

    • wider crossarms

    • stronger X-bracing


⚠️ OTHER NOTABLE DISASTERS (brief)

🔹 Ukraine Power Grid Attacks (2015–2022)

  • Transmission towers destroyed by warfare

  • Required rapid emergency rebuild strategies

🔹 Texas Winter Storm (2021)

  • 345 kV grid derated due to icing + gas plant failures

  • Not as many towers collapsed, but systemwide collapse occurred

🔹 China Ice Storm (2008)

  • 1,500 towers damaged

  • Led to new anti-icing standards in China


⚙️ TOP ENGINEERING LESSONS ACROSS ALL DISASTERS

1. Vegetation Management = Protection Layer

  • Tree contact is the #1 cause of AC line faults worldwide.

  • Needs predictive thermal sag modeling.

2. Ice Loading Must Be Conservatively Designed

  • Ice storms cause more physical failures than hurricanes.

  • Anti-icing conductors and aerodynamic spacers essential.

3. Wide-Area Protection Systems Are Critical

Modern grids require:

  • synchrophasors (PMUs)

  • adaptive relays

  • traveling-wave fault locators

  • dynamic islanding

4. Redundancy Must Be Built into Transmission Corridors

Parallel lines reduce the risk of cascading outages.

5. Climate Models Must Be Updated

Old wind/ice maps are no longer valid due to:

  • climate change

  • new storm patterns

  • extreme weather intensification

Top 5 Longest Overhead AC Transmission Lines in the World


Top 5 Longest Overhead AC Transmission Lines in the World

High-voltage engineering, record-setting distances, and the innovations that made them possible

This list EXCLUDES HVDC and includes only pure overhead AC transmission systems, 220 kV to 765 kV and above.

If you want the Blogger-ready HTML version, just tell me.


🌍 TOP 5 LONGEST OVERHEAD AC TRANSMISSION LINES IN THE WORLD


1. Belo Monte – Estreito – Miracema 500 kV AC Transmission System (Brazil)

Length: 2,400 km (approx.)
Voltage: 500 kV AC
Type: Overhead
Utility: Eletrobras / ISA CTEEP

Although Belo Monte is famous for its UHVDC link, it also has the longest AC overhead backbone in Brazil feeding load centers and stabilizing the AC grid.

Key Engineering Challenges

1. Very Long AC Corridor Stability

Over 2,400 km of uninterrupted AC overhead line required:

  • series compensation

  • shunt reactors

  • controlled switching

  • advanced protection (distance + differential)

2. Tropical Lightning Belt

Lightning density up to Ng = 15/km²/year

  • double OPGW protection

  • ultra-low tower footing resistance (≤10 Ω)

3. Tower Design for Hilly + Forest Terrain

Required:

  • multi-circuit 500 kV towers

  • heavy-duty crossarms

  • Corten steel for corrosion resistance


2. Grand Ethiopian Renaissance Dam (GERD) 500 kV AC Transmission Network (Ethiopia → Sudan)

Length: ~1,000 km total
Voltage: 500 kV AC
Type: Overhead
Operator: Ethiopian Electric Power

This is East Africa’s largest 500 kV AC project, built to export hydropower and interconnect grids.

Technical Challenges

1. Desert + Mountain Terrain

The line spans:

  • deep river gorges

  • cliffs

  • hot desert plains (>45°C)

This required:

  • high-temperature low-sag (HTLS) conductors

  • reinforced foundations

  • increased insulator creepage distance

2. Grid Synchronization

Long AC export corridors need:

  • power system stabilizers

  • dynamic reactive support

  • FACTS devices (SVC, STATCOM)


3. Rio Madeira 600 kV / 500 kV AC Transmission System (Brazil)

Length: >1,900 km
Voltage: 500 kV AC
Type: Overhead
Operator: Madeira Energia / Eletrosul

Although the Madeira project uses HVDC for bulk transfer, the parallel 500 kV AC system is one of the world’s longest AC overhead corridors.

Major Challenges

1. Crossing the Amazon Basin

  • swamp zones

  • floodplains

  • heavy vegetation → requires helicopter tower erection

2. High Lightning Performance Requirements

  • double shield wires

  • target grounding ≤ 5–8 Ω

  • long-span towers with improved geometry

3. Voltage Stability on Long AC Lines

AC lines above 1,500 km face serious stability risks:

  • Ferranti effect

  • reactive power fluctuations

  • voltage rise at no-load

Solutions:

  • shunt reactors every 200–300 km

  • series compensation

  • intelligent line switching


4. Queensland–New South Wales Interconnector (QNI), 330 kV AC (Australia)

Length: ~915 km combined 330 kV overhead lines
Voltage: 330 kV AC
Type: Overhead
Operators: Powerlink Queensland, TransGrid

This is Australia’s longest continuous 330 kV AC interconnection, serving as the backbone of the National Electricity Market (NEM).

Technical Challenges

1. Extreme Bushfire and Heat Conditions

Summer temperatures reach 45–47°C →

  • high-temp conductor ratings

  • anti-galloping systems

  • fire-resistant structures

2. Very Long AC Stability Requirements

Over 900 km requires:

  • reactive power compensation

  • wide-area protection relays

  • controlled power oscillation damping


5. Nelson River 500 kV AC Transmission System (Canada)

Length: ~900 km (AC portion)
Voltage: 500 kV AC
Type: Overhead
Operator: Manitoba Hydro

Mostly known for its HVDC bipoles, the Nelson River also includes a long AC 500 kV overhead corridor used for regional transfer and grid stability.

Engineering Challenges

1. Arctic Winters & Icing Loads

Temperatures drop to –40°C, with:

  • heavy icing

  • ice shedding

  • galloping

Required:

  • aerodynamic spacers

  • ice-resistant bundles

  • weathering steel towers

2. Long-Distance AC Control

Cold-weather high-resistivity soil →

  • high tower footing resistance

  • compensated by double shield wires + LSAs

TOP 5 LONGEST TRANSMISSION LINES IN THE WORLD


TOP 5 LONGEST TRANSMISSION LINES IN THE WORLD

Engineering Challenges, Technical Innovations, and Why These Mega-Projects Are Power System Marvels


1. Belo Monte–Rio de Janeiro UHVDC Transmission Line (Brazil)

Length: 2,543 km
Voltage Level: ±800 kV DC
Power Capacity: 4,000 MW
Technology: UHVDC (Ultra High Voltage Direct Current)

Why It’s Extraordinary

This is one of the longest and most remote UHVDC lines on earth, carrying Amazon hydroelectric power to Brazil’s coastal cities.

Major Technical Challenges

a) Extreme Terrain (Amazon Rainforest)

  • The line crosses dense rainforest, swamps, rivers, and mountainous areas.

  • Foundation design required deep piles and corrosion-resistant structures.

b) Lightning & Storm Exposure

The Amazon basin is among the highest lightning activity regions on the planet (Ng > 12–15).
Required:

  • Improved shielding design

  • Ultra-low footing resistance

  • Wide-phase spacing

c) Environmental Protection

Right-of-way design minimized deforestation through:

  • Compact tower design

  • Reduced corridor width

Key Engineering Innovations

  • Use of hybrid steel–composite conductors to reduce sag in hot climates

  • High-performance 800 kV converter stations

  • Real-time wide-area protection systems (WAPS)


2. Jinping–Sunan UHVDC Transmission Line (China)

Length: 2,090 km
Voltage: ±800 kV DC
Capacity: 7,200 MW
Region: Sichuan → Eastern China

Technical Challenges

a) Extreme Mountain Terrain

The route crosses mountains exceeding 4,000 meters elevation, requiring:

  • High-altitude tower design

  • Wind load design > 70–80 m/s

  • Frost/icing conditions

b) Ultra-long spans

Spans exceeding 1,500 meters demanded:

  • High-strength conductors

  • High tension towers

  • Special sag-tension studies

Innovations

  • Composite insulators with high creepage

  • High altitude corona mitigation

  • Optimized tower geometries for steep slopes


3. Xiangjiaba–Shanghai UHVDC Transmission Line (China)

Length: 1,907 km
Voltage: ±800 kV
Capacity: 6,400 MW

Why It’s Important

It was the world’s first commercial ±800 kV UHVDC line, marking China’s entry into large-scale UHV transmission.

Engineering Challenges

a) High Temperature Sag

China’s inland provinces experience summer temperatures > 40°C.

  • Conductors had to meet strict HTLS requirements

  • Special sag-tension control with PLS-CADD

b) Long Route, High Stability Requirement

  • Earthquake-prone regions → seismic-resistant tower foundations

  • Multi-climate zones: dry, humid, coastal, industrial

Engineering Innovations

  • “Large bundle conductors” for corona loss minimization

  • Strategic placement of line surge arresters

  • Massive GIS converter stations


4. Champa–Kurukshetra HVDC (India)

Length: 1,365 km
Voltage: ±800 kV
Capacity: 6,000 MW

Technical Challenges

a) Heavy Lightning Activity

Central and eastern India have Ng values up to 14–16 flashes/km²/year.

Required:

  • Deep grounding (10 Ω targets across high-resistivity soils)

  • Optimized shielding angle (12–15°)

  • Double ground wires

b) Monsoon Season

Monsoon storms created:

  • Tower overturning risks

  • Conductor galloping

  • High wind pressures

Innovations

  • Flexible AC transmission systems (FACTS) at receiving ends

  • Sag and tension real-time monitoring

  • High-ampacity conductors (ACSR & ACCC combinations)


5. Pacific DC Intertie (United States)

Length: 1,362 km
Voltage: ±500 kV HVDC
Capacity: 3,100 MW
Route: Oregon → Los Angeles

Why This Line Is Historic

Built in the 1970s, it remains one of the world’s longest and most reliable HVDC systems.

Technical Challenges

a) Crossing the Cascade Mountains

Required:

  • Weather-resistant structures

  • Snow + wind + ice loading checks

  • Customized foundation design

b) Aging Infrastructure Upgrade

The line required:

  • Conductor uprating

  • Tower retrofits

  • Converter station modernization

Key Innovations

  • One of the earliest thyristor-controlled HVDC systems

  • Use of wide-area monitoring systems (WAMS)

  • Advanced converter station rebuild in the 2010s

Transmission Line Conductor Selection: ACSR, AAAC, ACSS, ACCC, HTLS – Technical Comparison

Transmission Line Conductor Selection: ACSR, AAAC, ACSS, ACCC, HTLS – Technical Comparison

An in-depth engineering reference on conductor types, mechanical properties, thermal limits, sag-tension behavior, corona performance, and cost-effectiveness for modern transmission line design.

1. Introduction

Conductor selection affects electrical performance, mechanical loading, sag, thermal rating, reliability, and project cost. This guide compares ACSR, AAAC, ACCC, ACSS, and HTLS conductors using engineering criteria.

2. Key Electrical Parameters

  • Ampacity
  • Corona onset voltage
  • Radio interference voltage (RIV)
  • Skin effect
  • AC resistance

3. Mechanical Parameters

  • Ultimate tensile strength
  • Modulus of elasticity
  • Creep
  • Wind and ice loads

4. Conductor Types

4.1 ACSR (Aluminum Conductor Steel Reinforced)

The most widely used conductor due to high tensile strength and cost-effectiveness.

4.2 AAAC (All Aluminum Alloy Conductor)

Corrosion-resistant, lighter, higher conductivity.

4.3 ACSS (Aluminum Conductor Steel Supported)

Designed for high-temp operation up to 200°C.

4.4 ACCC (Advanced Composite Core Conductor)

Hybrid carbon/glass core with low sag and high current rating.

4.5 HTLS Conductors

High Temperature Low Sag technology for uprating existing lines.

5. Sag–Tension Performance Comparison

TypeSag @ 25°CSag @ 75°CRating
ACSR Drake11.9 m15.8 mGood
ACSS Drake12.1 m13.5 mVery Good
ACCC Drake9.1 m9.9 mExcellent

6. Corona Performance

ACCC and AAAC offer superior corona behavior due to smoother surfaces.

7. Cost & Lifecycle Analysis

  • ACSR – lowest cost
  • AAAC – moderate
  • ACSS – moderate
  • ACCC – highest initial cost but best performance

8. Sample Calculation (ACSR Drake, 450 m Span)

Using parabolic sag approximation:

s = wL² / (8H)

9. Best Practices

  • Match conductor type with terrain and rating requirements
  • Use HTLS for uprating existing corridors
  • Use ACCC in long spans or harsh terrain
  • Use AAAC in corrosive/coastal regions

Transmission Line Grounding Design: Tower Footing Resistance, Lightning Performance, and IEEE/CIGRE Standards

Transmission Line Grounding Design: Tower Footing Resistance, Lightning Performance, and IEEE/CIGRE Standards

An authoritative engineering guide covering tower grounding, soil resistivity, grounding techniques, backflashover reduction, and lightning performance optimization.

1. Purpose of Transmission Line Grounding

  • Control tower voltage rise during lightning
  • Minimize backflashover probability
  • Dissipate earth fault current
  • Ensure touch and step voltage safety

2. Soil Resistivity Measurement (IEEE 81)

The Wenner 4-pin method calculates soil resistivity:

ρ = 2πaR

Where a = pin spacing, R = measured resistance.

3. Soil Modeling

  • Single-layer soil
  • Two-layer soil
  • Multi-layer soil (CIGRE)

4. Tower Footing Resistance (TFR) Targets

VoltageTarget TFR
69 kV25 Ω
115–138 kV15–20 Ω
230 kV10 Ω
500 kV5–7 Ω

5. Tower Grounding Methods

  • Counterpoise wires
  • Ground rods (multiple)
  • Deep rods
  • Chemical-enhanced rods
  • Ground boosters

6. Lightning Current Distribution

Tower voltage rise:

V = I * Rt

7. Backflashover Reduction

  • Lower TFR
  • Increase insulator string length
  • Improve shielding angle
  • Install line arresters

8. CIGRE Methods for LLP

CIGRE defines statistical computations for backflashover and shielding failure probability.

9. Numerical Example (230-kV Tower)

  • Soil resistivity = 400 Ω·m
  • Single counterpoise 60 m
  • Final TFR achieved = 12 Ω

10. Measuring Footing Resistance

Use the Fall-of-Potential method:

Rt = V / I

11. Ground Boosting Techniques

  • Parallel counterpoise
  • Additional rods
  • Soil conditioning
  • Mesh grounding

Transmission Line Sag & Tension: Complete Engineering Guide (IEC 60826 / ASCE 74 / PLS-CADD)

Transmission Line Sag & Tension: Complete Engineering Guide (IEC 60826 / ASCE 74 / PLS-CADD)

A full technical guide on sag–tension engineering for overhead transmission lines, covering ruling span, catenary equations, creep, blowout, safety clearances, and PLS-CADD modeling.

1. Introduction

Sag–tension design ensures that transmission line conductors maintain safe clearances, acceptable mechanical stresses, proper thermal limits, and compliance with IEC, ASCE, and utility standards. Sag varies with temperature, tension, loading, and conductor properties such as elasticity and creep.

2. Catenary vs. Parabolic Sag Models

The real conductor forms a catenary curve described by:

s = (H/w) * (cosh(wL/H) – 1)

Where H = horizontal tension, w = weight per unit length, L = span.

For spans < 300 m, the parabolic approximation is acceptable:

s ≈ (wL²) / (8H)

3. Ruling Span Theory

For unequal spans between two dead-end structures, sag–tension calculations use a single equivalent span:

LR = Σ(L³) / Σ(L²)

4. Conductor Mechanical Properties

  • Cross-sectional area
  • Modulus of elasticity
  • Thermal expansion coefficient
  • Creep characteristics
  • Stranding and lay ratio

5. Initial vs. Final Sag

Initial sag occurs immediately after stringing. Final sag includes long-term creep and permanent elongation.

6. Temperature and Sag

Sag increases with temperature due to thermal expansion:

ΔL = α * L * ΔT

7. Everyday, Maximum, Minimum Temperature Cases

  • Everyday (EDL): 10–40°C
  • Maximum: 70–100°C
  • Minimum: –5 to –20°C

8. Ice & Wind Load Cases (Heavy Load Sags)

ASCE 74 defines:

  • Vertical load = conductor weight + ice
  • Horizontal load = wind pressure

9. Safety Clearances

Per IEC / utility standards:

  • Ground clearance
  • Road crossing clearance
  • River crossing clearance
  • Building separation

10. Conductor Blowout & Swing

θ = arctan(Fw / T)

Where Fw = wind load, T = tension.

11. Numerical Example (ACSR Drake, 400 m Span)

  • w = 1.071 kg/m
  • H = 18 kN
  • L = 400 m

Parabolic sag:

s = wL² / (8H) = 1.071*400²/(8*18000) = 11.9 m

12. PLS-CADD Sag–Tension Modeling

PLS-CADD calculates sag using exact catenary equations, conducting initial and final condition analysis for multiple load cases.

13. Common Engineering Mistakes

  • Using average span instead of ruling span
  • Ignoring creep
  • Using wrong temperature cases
  • Failure to include blowout

Line Lightning Performance (LLP) Analysis for Transmission Lines – Complete Technical Guide with Numerical Example

Line Lightning Performance (LLP) Analysis for Transmission Lines – Complete Technical Guide with Numerical Example

A professional engineering reference covering shielding failure, backflashover, CIGRE/IEEE methods, and full worked calculations using real numerical values.

1. Introduction

Line Lightning Performance (LLP) quantifies how often a transmission line experiences flashovers due to lightning. It is typically expressed in:

Flashovers per 100 km per year

LLP analysis is essential for predicting outage rates, optimizing shielding, grounding, tower geometry, and ensuring compliance with reliability targets such as:

  • 69–115 kV lines: 3–6 outages /100 km-year
  • 138–230 kV lines: 1–3 outages /100 km-year
  • 345–500 kV lines: < 1 outage /100 km-year

This guide provides a full technical explanation of LLP analysis based on CIGRE, IEEE, and Eriksson models, using a 230 kV transmission line with actual numerical values.

2. Types of Lightning Flashovers

2.1 Backflashover (BF)

Occurs when lightning strikes the tower or ground wire, raising the tower potential enough to flash over the insulator string.

Lightning → Tower → High Tower Voltage → Insulator Flashover

2.2 Shielding Failure Flashover (SFF)

Occurs when lightning bypasses the shield wire and strikes the phase conductor directly. This depends on shielding angle, conductor height, and striking distance.

Lightning → Misses Ground Wire → Hits Conductor → Flashover

3. Key Input Parameters for LLP

ParameterDescriptionExample Value
NgGround flash density12 flashes/km²-year
hTower height40 m
hsShield wire height42 m
hcConductor height32 m
ρSoil resistivity400 Ω·m
RtTower footing resistance15 Ω
θShielding angle25°
CFOCritical flashover voltage1050 kV

4. Lightning Stroke Current Distribution

Lightning current follows the well-known IEEE distribution:

P(I > i) = exp(-i / 31)

Where 31 kA is the median current.

5. Shielding Failure Flashover (SFF) Calculation

5.1 Striking Distance (Eriksson Model)

Rs = 10 * I^0.65

Where Rs = lightning striking distance.

5.2 Critical Current for Shielding Failure

Using Eriksson’s geometry:

I_crit = ((hs - hc) / 10)^(1 / 0.65)

Using example values:

  • hs = 42 m
  • hc = 32 m
I_crit = ((42 - 32) / 10)^(1/0.65)
       = (1)^1.538 = 1 kA

Meaning any lightning stroke above 1 kA can theoretically hit the conductor unless shielding is adequate.

5.3 SFF Rate

SFF = Ng * P(I > I_crit) * L

Compute P(I > 1):

P = exp(-1 / 31) = 0.968

Assume exposure width L = 0.03 km.

SFF = 12 * 0.968 * 0.03 = 0.35 flashovers/100 km-year

6. Backflashover (BF) Calculation

6.1 Tower Surge Voltage

V_tower = I * Rt

Flashover occurs when:

V_tower > CFO

With Rt = 15 Ω, CFO = 1050 kV:

I_BF = 1050 / 15 = 70 kA

6.2 Probability of Current Exceeding 70 kA

P(I > 70) = exp(-70 / 31) = exp(-2.26) = 0.104

6.3 Number of Tower Strokes (per 100 km)

N_t = Ng * (0.1h + 3) * 100
N_t = 12 * (0.1*40 + 3) * 100
N_t = 12 * 7 * 100 = 8400 strokes/100 km-year

For a 350 m span:

Towers per 100 km = 100,000 / 350 = 285 towers

6.4 Backflashover Rate

BF = (N_t / Towers) * P(I > 70)
BF = (8400 / 285) * 0.104 = 29.47 * 0.104 = 0.0876 flashovers/100 km-year

7. Total Lightning Performance (LLP)

LLP = SFF + BF
LLP = 0.35 + 0.0876 = 0.4376 flashovers/100 km-year

Interpretation

A value of 0.44 flashovers/100 km-year represents excellent lightning performance for a 230 kV line. Most utilities target:

  • < 3 for 115 kV
  • < 1–2 for 230 kV
  • < 1 for 345–500 kV

8. Methods to Improve Lightning Performance

  • Reduce tower footing resistance (target <10 Ω)
  • Improve shielding angle (from 25° → 15°)
  • Raise ground wire height
  • Add a second shield wire
  • Increase insulator string length (higher CFO)
  • Install Line Surge Arresters (LSA) in problematic spans

9. Summary of Example Results

ParameterValue
Ng12 flashes/km²-year
Shielding angle25°
Tower footing resistance15 Ω
BIL (CFO)1050 kV
SFF0.35
BF0.0876
Total LLP0.44 flashovers/100 km-year

This design meets strict reliability standards for 230 kV overhead transmission lines.

INSULATION COORDINATION FOR TRANSMISSION LINES: COMPLETE TECHNICAL GUIDE (IEC 60071, IEC 60826, IEEE C62)


INSULATION COORDINATION FOR TRANSMISSION LINES: COMPLETE TECHNICAL GUIDE (IEC 60071, IEC 60826, IEEE C62)


1. Introduction

Insulation coordination is one of the most critical components of transmission line design. It ensures that line insulation, hardware, insulators, air clearances, towers, and surge protection systems can reliably withstand the electrical stresses imposed by:

  • lightning impulses

  • switching surges

  • temporary overvoltages (TOV)

  • power-frequency overvoltages

  • backflashovers and shielding failures

Poor insulation coordination directly leads to:

  • high line outage rates

  • unnecessary tripping

  • insulator flashover

  • equipment damage

  • reduced reliability indices (SAIDI, SAIFI)

  • unacceptable lightning performance

Modern utilities follow international standards such as:

  • IEC 60071-1 & 60071-2 (main standard for insulation coordination)

  • IEC 60826 (overhead line reliability)

  • IEEE C62 (surge protection)

  • CIGRE Technical Brochures (TB) on lightning performance

  • Utility-specific manuals (e.g., NGCP TLDS, PGES)

This article provides a comprehensive and extremely detailed methodology for conducting insulation coordination for high-voltage transmission lines ranging from 69 kV to 500 kV and beyond.


2. Objectives of Insulation Coordination

Insulation coordination aims to:

✔ Determine insulation levels

Determine the BIL (Basic Insulation Level) and SIL/SWL required for:

  • insulators

  • air clearances

  • tower geometry

  • substation interfaces

✔ Limit the probability of flashover

Maintain a design where the probability of flashover is lower than a target value defined by standards.

✔ Optimize insulation cost

Avoid overdesign (expensive, unnecessary insulation) and underdesign (prone to outages).

✔ Ensure consistency across the system

Transmission lines, substations, transformers, breakers, surge arresters must all share a coordinated insulation scheme.


3. Types of Overvoltages Considered in Insulation Coordination


3.1 Lightning Overvoltages

These are fast-front surges (1.2/50 μs) due to:

  • direct lightning strikes

  • backflashover

  • shielding failures

  • induced overvoltages

Lightning surges require insulation with sufficient BIL.


3.2 Switching Overvoltages

Slow-front surges (250/2500 μs) caused by:

  • line energization

  • line de-energization

  • reclosing

  • fault clearing

  • load rejection

At 345 kV and above, switching surges govern insulation design, not lightning.


3.3 Temporary Overvoltage (TOV)

Power-frequency sustained overvoltages from:

  • unbalanced faults

  • ferroresonance

  • ground faults

  • load rejection issues

TOV influences the withstand capabilities of long air gaps, hardware, and surge arrester duty.


3.4 Power Frequency Overvoltage

Normally occurs during:

  • phase-to-ground faults

  • load rejection

  • improper synchronizing


4. Key Insulation Parameters

4.1 BIL (Basic Insulation Level)

The withstand capability under a lightning impulse.

Typical BIL values:

  • 69 kV → 325 kV BIL

  • 115 kV → 550 kV BIL

  • 230 kV → 1050–1100 kV BIL

  • 500 kV → 1550–1800 kV BIL


4.2 CWW (Chopped Wave Withstand)

Important for switching operations where gas breakers generate chopped-wave stresses.


4.3 SIWL (Switching Impulse Withstand Level)

Governs EHV/UHV (>300 kV) lines.

Typical:

  • 345 kV → ~900 kV SIWL

  • 500 kV → 1050–1200 kV SIWL


4.4 CFO (Critical Flashover Voltage)

Voltage at which insulation flashes over 50% of the time.

CFO directly determines:

  • air clearance

  • tower geometry

  • insulator string length


5. Insulation Coordination Methodology (IEC 60071-2)


STEP 1 — Identify All Overvoltage Stresses

For each voltage class, determine:

  • lightning impulse stresses

  • switching impulse stresses

  • TOV stresses

  • induced overvoltages

  • arrester discharge voltages

Use:

  • EMTP simulations

  • line energization studies

  • fast-front surge modeling


STEP 2 — Determine Insulation Withstand Levels

Use withstand curves from:

  • IEC 60071 tables

  • manufacturer specs

  • CIGRE guides

Insulation types:

  1. External insulation

    • air clearances

    • insulator strings

    • tower hardware

  2. Internal insulation

    • equipment in substations

    • transformer windings

    • breaker gaps

Transmission lines use external insulation coordination almost exclusively.


STEP 3 — Select BIL & SIWL Values

Governed by:

  • shielding angle

  • tower height

  • lightning density (Ng)

  • ground resistivity

  • tower footing resistance

BIL must be:

  • greater than all expected lightning surges

  • compatible with surge arrester protective levels

  • coordinated with adjacent substations


STEP 4 — Determine Air Clearances

Using curves from:

  • IEC 60071-2 (air gap withstand)

  • EPRI / CIGRE

  • Utility standards

Air gap withstand depends on:

  • atmospheric correction factor (Ka)

  • altitude correction factor

  • polarity of impulse

  • gap geometry

Example clearance requirement for 230 kV:

  • phase-to-ground: 2.7–3.5 m

  • phase-to-phase: 3.5–4.5 m


STEP 5 — Shielding Against Lightning

Transmission lines must minimize:

  • backflashover

  • shielding failure flashover

a) Shielding angle

Typical:

  • 230 kV: 20–30°

  • 500 kV: 10–15°

b) Ground wire placement

  • 1 or 2 GW wires

  • sometimes OPGW

c) Tower footing resistance

Target:

  • <10 Ω for 230–500 kV

  • lower in high lightning areas


STEP 6 — Backflashover Analysis

Backflashover occurs when:

  • lightning hits tower or shield wire

  • tower potential rises

  • insulator string flashes over

Calculate tower voltage rise:

V=IR+LdidtV = I \cdot R + L\frac{di}{dt}

Where:

  • I = lightning current

  • R = footing resistance

  • L = tower inductance

Flashover probability determined using:

  • CFO curves

  • EMTP models

  • CIGRE TB 63/195/411 methods


STEP 7 — Surge Arrester Coordination

Surge arresters limit overvoltage magnitude.

Insulation must satisfy:

Withstand Level>Arrester Discharge Voltage×Margin\text{Withstand Level} > \text{Arrester Discharge Voltage} \times \text{Margin}

Typical margin:

  • 15% lightning

  • 25% switching

At 345–500 kV lines, series compensation may require line side surge arresters.


STEP 8 — Switching Surge Evaluation

For EHV/UHV lines, switching surges dominate.

Factors:

  • line length

  • line energization sequence

  • pre-insertion resistors

  • trapped charge

  • reclosing timing

Target switching surge probability:

  • < 2% (IEC limit)

Simulated using EMTP, PSCAD, or ATP.


STEP 9 — Check Temporary Overvoltage (TOV) Performance

TOV must not exceed:

  • insulator power-frequency withstand

  • arrester thermal capability

Sources of TOV:

  • earth faults

  • resonance

  • load rejection

  • ferroresonance

TOV values can reach:

  • 1.4–1.8 pu on unfaulted phases

  • 2.0–2.5 pu in isolated systems


STEP 10 — Final Insulation Coordination Check

Complete check includes:

  • lightning impulse withstand

  • switching impulse withstand

  • TOV withstand

  • arrester coordination

  • clearance compliance

  • shielding performance

  • grounding adequacy

Output documentation includes:

  • insulation selection sheet

  • CFO vs surge margin table

  • shielding failure rate (SFR) calculation

  • backflashover rate (BFR)

  • EMTP simulation results


6. Lightning Performance of Transmission Lines

Utilities target:

  • < 1–3 flashes / 100 km / year on 230 kV

  • < 0.5–1 flash / 100 km / year on 500 kV

Lightning performance depends on:

  • Ng (ground flash density)

  • tower height

  • shielding angle

  • conductor height

  • ground wire position

  • footing resistance

CIGRE provides analytical models:

  • Eriksson model

  • Wagner model

  • Rusck model

  • Transmission line lightning performance model (CIGRE TB 63)


7. Insulation Coordination Example (230 kV Line)


Step-by-step:

  1. Determine lightning & switching surges using EMTP

  2. Select BIL = 1050 kV

  3. Select SIWL = 850 kV

  4. Calculate minimum air clearances

  5. Model shielding with 25° angle

  6. Set tower footing resistance ≤10 Ω

  7. Check backflashover probability

  8. Select arresters with Upl = 650–700 kV

  9. Verify margins:

    BIL>Upl×1.15BIL > Upl \times 1.15
  10. Validate performance using CIGRE SFR/BFR formulas


8. Why Transmission Line Insulation Coordination Must Be Done Professionally

Insulation coordination directly affects:

  • system reliability

  • CAPEX (insulator selection)

  • tower geometry

  • outages and SAIFI/SAIDI

  • compliance with IEC/IEEE/utility standards

Under-designed insulation → outages, failures, safety hazards
Over-designed insulation → excessive cost


9. Summary

This technical guide demonstrated that insulation coordination for transmission lines requires:

  • advanced surge modeling

  • rigorous comparison of withstand vs stress curves

  • coordinated performance of arresters, insulators, towers

  • shielding & grounding optimization

  • compliance with IEC 60071, IEEE, CIGRE

High-voltage and extra-high-voltage lines depend on precise insulation coordination to maintain safe and reliable operation under lightning and switching transient conditions.

Top 5 Worst Transmission Line Disasters in History

  Top 5 Worst Transmission Line Disasters in History Causes, technical failures, cascading effects, and engineering lessons learned This a...

free counters